John Hatley

UX Designer

Environmental Health Overview Application

Migrating a windows-based application to the cloud and improving usability.

Basics

Year:

2019/2020

Tools Used:

Figma, Axure

Role:

UX/UI Design

About

Business Goal:

Provide new and existing clients proven diagnosis capabilities via a cloud-based application and improve user efficiency in diagnosing and resolving environmental issues.

Tasks:

Replicate existing feature set into a cloud-based application, improve usability and reduce the learning curve.

My Role:

My role was to lead the user research, perform holistic review of the existing application, deliver the UX and UI patterns, build a clickable prototype and perform end user testing and validation.

User Research

Interviews and Observations:

2 Groups of 5 - Existing Users/Free Agents

Existing Users:

Experience with the Windows application ranged from 1 to 12 years.

Free Agents:

DBA's, Developers and Generalists with 1-8 years of DB experience.

Findings & Collateral

Most Important Data:

Users identified several areas in the existing interface that were either confusing or missing:

  • no historical context
  • no peer (server) context
  • control of the metrics and details displayed
  • cognitive load as a result of the existing charts
  • unclear of score meaning
  • no summary data
  • unclear "where to start"
  • a sense of "detail" overload
  • coloring of the score

These issues were common within most areas of the legacy application, as the application delivers mass amounts of grid-based data directly to the user by default.

Prior to design:

In addition to the user input, I leaned on a few other information sources to help provide a complete picture prior to designing:

  • existing training materials, product backlog of bugs/enhancements, competitor's offerings
  • engineering and architecture team members to best identify limitations and performance considerations
  • competitor's offerings
  • product management was consulted for business priorities

Solution

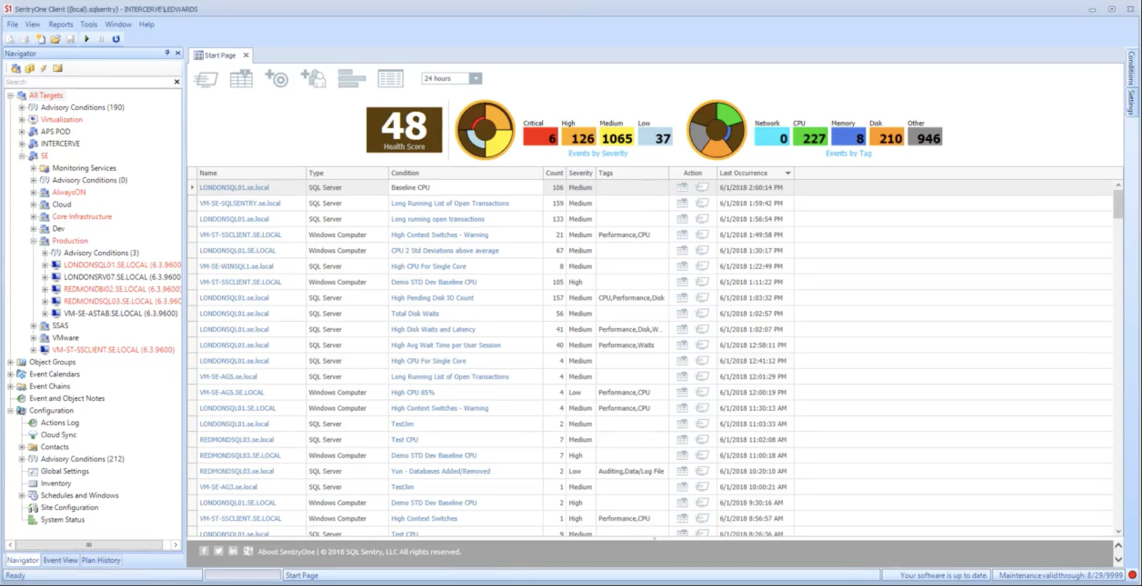
The legacy application provides the users with a colored, numeric "Heath Score". Users pointed out that the score included All servers (dev, test, etc.) versus just production, which is the main concern in 99%. The score's color code is calculated based on the score, which means the color palette is an extremely large gradient with little to no differentiation between levels. The pie charts located to the right of the score represent the volume of specific issue types and their contribution to the degradation of the score. Also listed are the counts of severity and type of the issues across the environment. Both the chart elements and the numeric counts serve as filters for the grid listing in the bottom half of the page.
Legacy Application
Legacy Application

Once I had completed my research, I was able to determine several opportunities for improvement as well as what proven elements to bring forward for the Environmental Health Overview page.
  • leverage a 10 point scale for coloring the scores (reducing the palette from 100 colors to 10)
  • provide context for the score by emphasizing best/worst and total number of servers
  • simple charts
  • segmentation and filter controls
  • duration formating was enhanced to highlight relevant values and provide for quicker eye scanning
  • options - users are provided new options for consuming the information visually
Overall, users like the idea of having a simple score to reflect the health, but most did not trust the value presented due to either their lack of control over contributing servers OR their lack of understanding in how it was calculated.
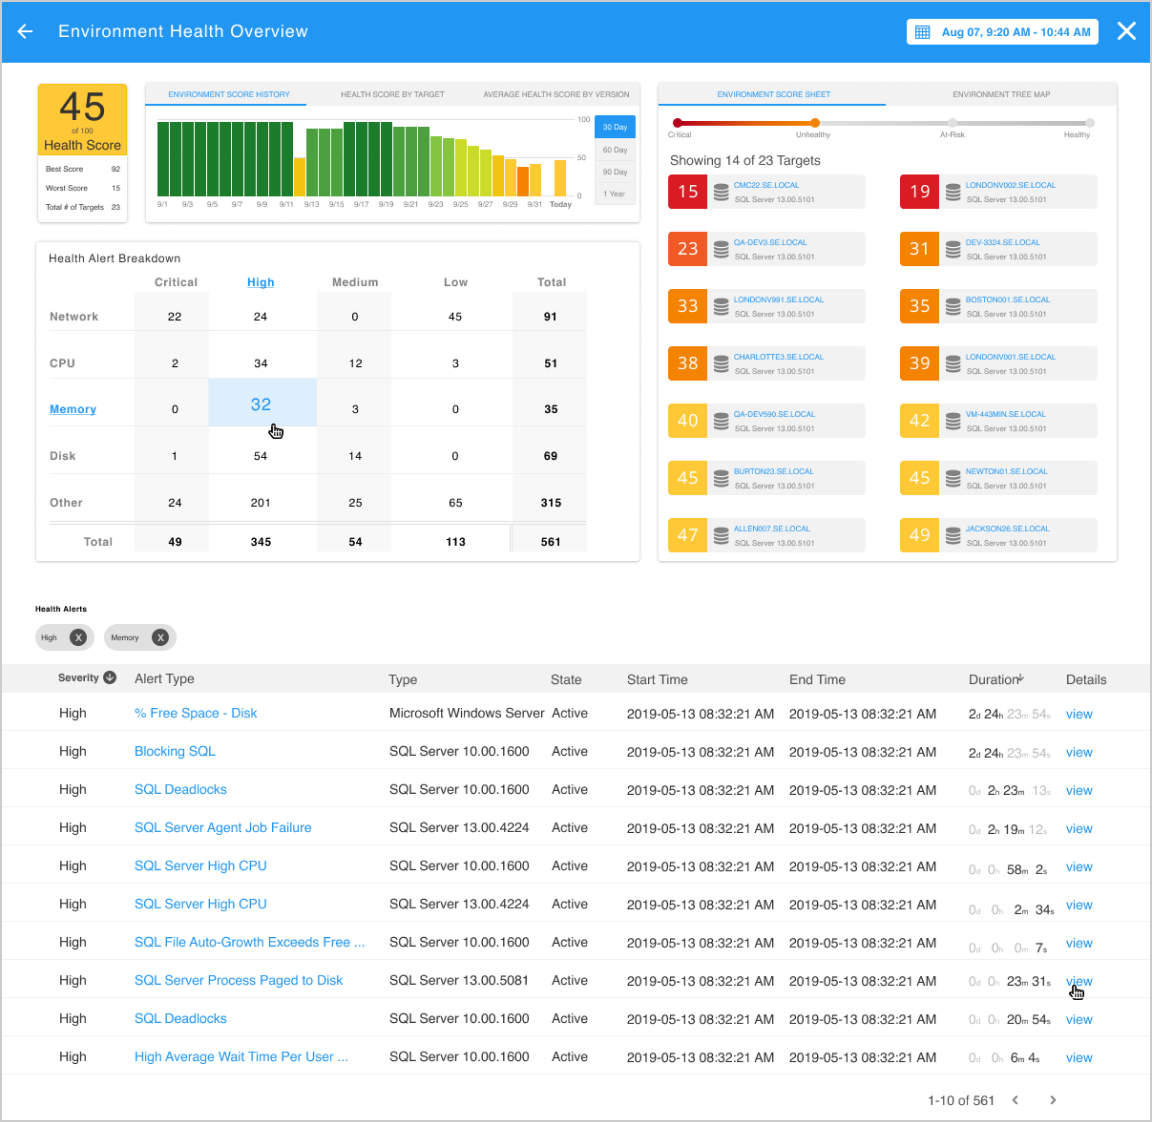
To accomodate the concerns and accomplish the goals, I began with the score itself. By providing the users with a bit of context around what the best and worst scores of individual servers are as well as the number of servers contributing, the score is less mysterious. I also provided some limitations to the coloring of the score by providing a 10 point scale for the color options.
Additional context is provided by leveraging some simple bar charts to explain the historical context of the score over a period of time determined by the user. Other charting options available are by individual server (aka Target) as well as database version.
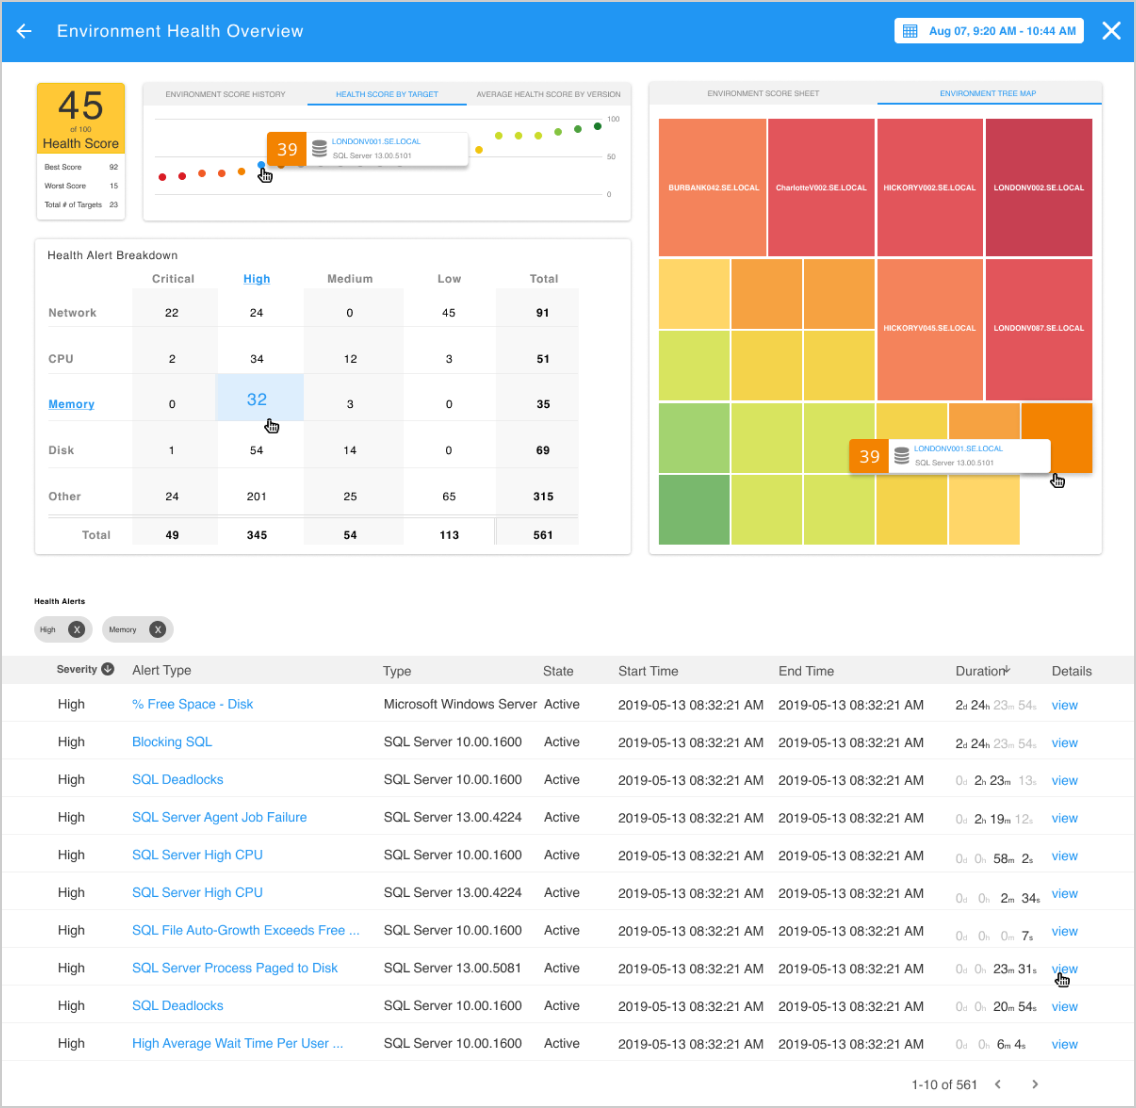
On the right side of the Overview, users are provided with a quick view of the servers included, their individual scores, versioning information as well as links to the overview pages for those specific servers. A heat map is also an optional view users can take advantage of, if list-style is not the preferred method of consumption. Users may also make use of the health slider to dial the list into the health status they are most concerned about reviewing.
The pie chart visuals were replaced with a matrix that more clearly shows the users the intersections of the type of events and their severity. This matrix also serves as a filter for the grid detail below.

My Design

Users have more control over how they consume and manipulate the overview information. By providing the historical and peer context, DBA's can easily compare performance from another period or among similar servers. These options allow DBA's to review performance at a summary level without having to navigate through details to make similar determinations.
  • History, Version and Averages are metrics which help DBA's quickly pinpoint problems in their environment.
  • Score sheet and Tree Map allow users to determine poor health at the server level with a simple glance.
  • Paging controls within the grid provide some relief from data overload.

Alternative View

Conclusion

After the initial conceptual review with product management and stakeholders I created a clickable prototype with Axure in order to conduct user testing. As part of the stakeholder review I agreed to conduct A/B testing with a more traditional (read copy/paste) version of the legacy interface that leveraged a hiearchical grid. I created that prototype as well and tested both with the following conclusions:
  • 10 users were identified for testing (5 existing customers trained and familiar with the legacy application and 5 non-customer DBA's).
  • 20 tasks were identified and scripted into the prototypes, matching details in each version.
  • 5 users tested with A first, then B and 5 were reversed so as not to bias their results.
  • The new design allowed users to identify the servers reducing overall health with a 100% success rate, vs. the legacy's 75%.
  • 10/10 users preferred the new version over the legacy version.
  • 10/10 users mentioned the clarity of the relationship between the score and color.
  • Data formating enhancement allowed users to complete related tasks 40% faster in the new design.
  • All users agreed the matrix presentation of severity/type was much more intuitive, especially when combined with the filter pills (above the grid)

Contact

Have a nice project coming up? Let’s talk about it! Shoot an email to john.hatley@gmail.com